In this guide, we'll walk you through how to check your user's resource usage on your web hosting account.
Start by logging into Direct Admin. NWLBRIf you are not sure how to do it, you can follow this guide
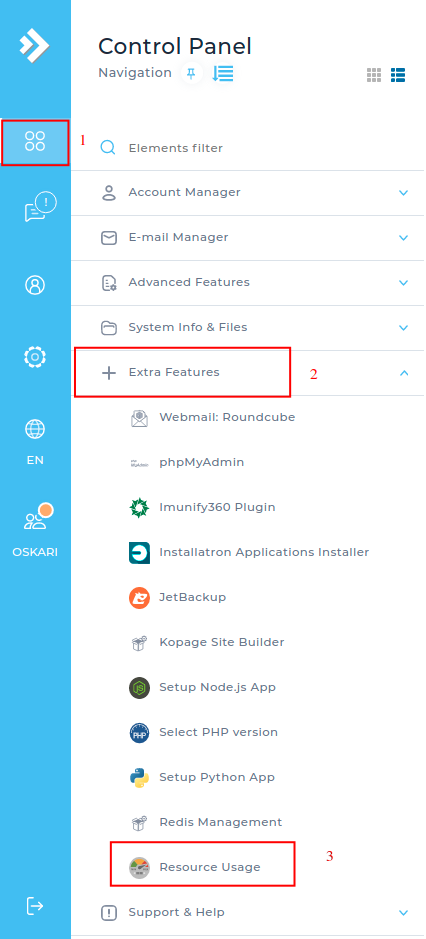
Then click on the four dots on the right(1) and then on + Extra Features and finally on Resource Usage(3)

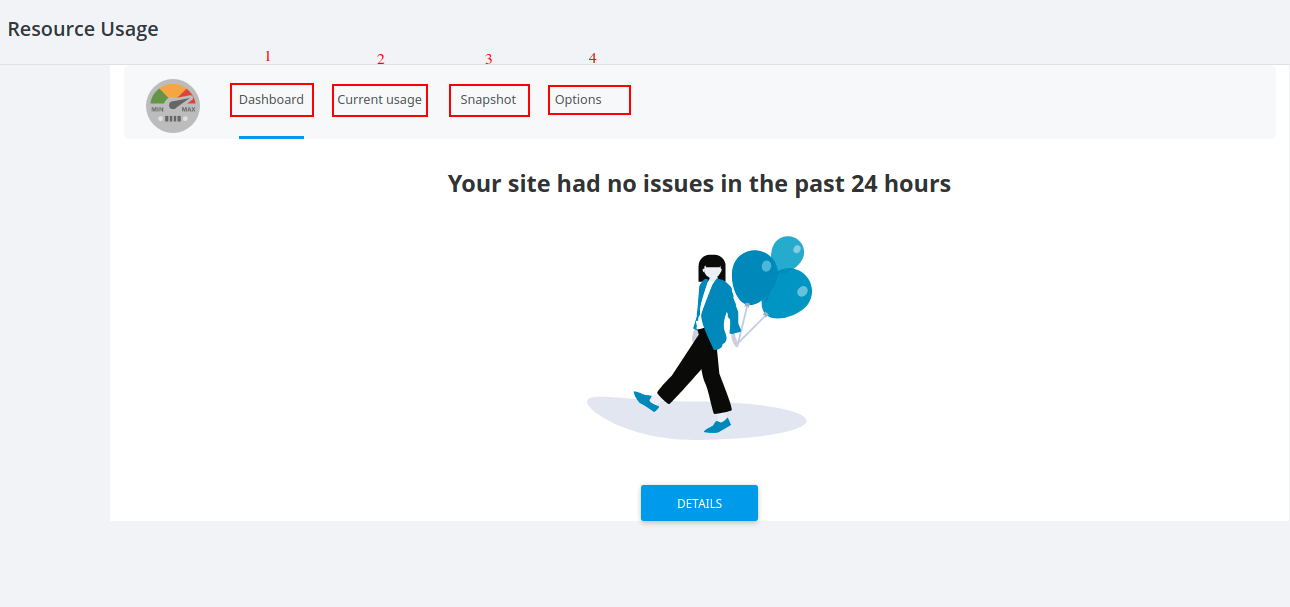
Here you can see if you had any problems with resource usage in the last 24 hours. It indicates if you have overused the resources or if any errors have appeared. In the I menu we find:
- Dashboard = The compilation that checks if there have been problems in the last 24 hours.
- Current Usage = Here you see all the information about how much resources you are using right now or specified by date and time.
- Snapshot = Should it be that you have any errors, you can see what is causing the errors through the snapshot.
-
Options= Here you set whether you want notifications sent to you by email.

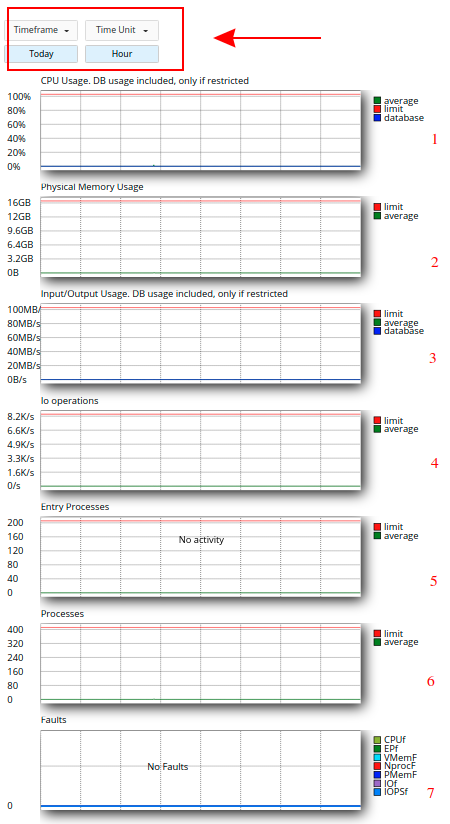
Current Usage: Start by setting the time interval you want to receive information about. You can choose several days in a row, or specific time. When the page is then updated, you will receive information about all resources.
- CPU Usage= Here you can see how much processing power is used during the selected time
- Physical Memory Usage = How much RAM has been used.
- Input/Output Usage = Indicates how much information the disk writes/reads per second.
- Io operations = Indicates how much disk activity is used.
- Entry Processes = Tells how many PHP, CGI or similar scripts are running at the same time
- Processes = Here you see how many processes are running at the same time. It counts all processes in your account.
-
Faults = The number of faults during the selected time period. It counts all the times the resources have gone through the roof.

Snapshot
Here you can see what is causing the errors. It saves snapshots as soon as resources are used up. You can also take part in what caused the resources to go through the roof.
If you hover over the paths under the heading CMD, you will get the entire path to the files.

 English
 Swedish
 French